Plotting Real-Time Air Quality Data from a Bluetooth Air Quality Monitoring Device Using MATLAB
March 29, 2024
With the rise of IoT devices, Bluetooth Low Energy (BLE) technology has emerged as a convenient solution for wireless data transmission. In this tutorial, we’ll explore how to read real-time air quality data from a BLE air quality monitoring device called HibouAir, and plot it using MATLAB. To accomplish this, we’ll utilize the BleuIO BLE USB dongle, which simplifies BLE application development with its AT command interface.
Project Components:
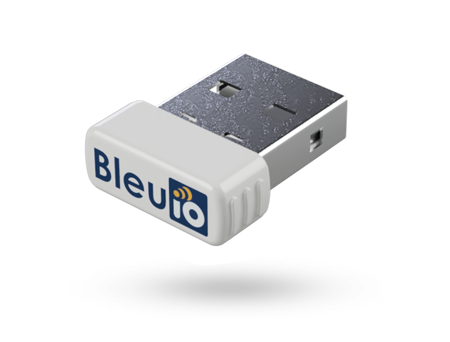
- BleuIO BLE USB Dongle: The BleuIO dongle serves as our BLE interface, allowing us to communicate with BLE devices using simple AT commands. Its plug-and-play nature and versatile features make it an ideal choice for BLE application development.
- HibouAir Air Quality Monitoring Device: HibouAir is a BLE-enabled air quality monitoring device that measures various parameters such as CO2, temperature, humidity, VOCs, and more. It provides real-time data transmission via BLE, making it suitable for IoT applications.
- MATLAB: MATLAB is a powerful computing environment widely used for data analysis, visualization, and algorithm development. We’ll leverage MATLAB’s capabilities to read data from the BleuIO dongle, decode BLE advertisements from HibouAir, and plot the air quality data in real-time.
Project Implementation:
Step 1: Setting up the Hardware
- Connect the BleuIO BLE USB dongle to your computer’s USB port.
- Power on the HibouAir air quality monitoring device.
Step 2: Writing MATLAB Code
- Define the serial port parameters in MATLAB to establish communication with the BleuIO dongle.
- Scan for a specific HibouAir device with its MAC address to get air quality advertised data.
- Implement functions to decode BLE advertisement data from HibouAir, including parsing CO2, temperature, humidity, and other relevant parameters.
- Write code to continuously scan for BLE advertisements, extract air quality data, and plot co2 value real-time using MATLAB’s plotting functions.
How This Project Can Be Helpful for Engineers, Developers, and Analysts
Environmental Monitoring: Engineers and analysts can use this project to create efficient environmental monitoring systems. By integrating BLE air quality monitors with MATLAB’s data analysis tools, they can assess air quality, detect anomalies, and optimize environmental control systems.
Use Case: A civil engineering firm employs this setup to monitor indoor air quality in commercial buildings, identifying areas needing ventilation improvements.
IoT Development: Developers can leverage this project to build IoT applications across various industries. By connecting BLE monitors with cloud platforms and mobile apps, they enable remote monitoring and predictive maintenance.
Use Case: A startup develops a mobile app for real-time air quality monitoring in urban environments, using BLE devices and MATLAB for data analysis.
Research and Analysis: Analysts and researchers can utilize this project to study air quality’s impact on human health and the environment. BLE monitors and MATLAB enable them to collect data, perform statistical analysis, and communicate research findings effectively.
Use Case: Environmental scientists deploy BLE monitors to measure traffic-related air pollution in urban areas, using MATLAB to analyze data and inform urban planning decisions.
Complete MATLAB Code:
% Define the serial port parameters
portName = 'COM8';  % Change this to match your dongle's port identifier
baudRate = 57600;   % Change this to match your dongle's baud rate
macaddress = '220069'; % Change this to match the desired MAC address

% Define adv_data_decode function if not defined already
function env_data = adv_data_decode(data)
    % Initialize output structure
    env_data = struct();

    % Find the position of the start of advertisement data
    pos = strfind(data, '5B070');

    % Convert hexadecimal data to decimal values
    temp_hex = convertNumber(data, pos+22, 4);
    if temp_hex > 1000
        temp_hex = (temp_hex - (65535 + 1)) / 10;
    else
        temp_hex = temp_hex / 10;
    end

    % Decode the advertisement data
    env_data.boardID = data(pos + 8 : pos + 8 + 5);
    env_data.type = hex2dec(data(pos + 6 : pos + 6 + 1));
    env_data.light = convertNumber(data, pos + 14, 4);
    env_data.pressure = convertNumber(data, pos + 18, 4) / 10;
    env_data.temperature = temp_hex;
    env_data.humidity = convertNumber(data, pos + 26, 4) / 10;
    env_data.voc = convertNumber(data, pos + 30, 4);
    env_data.co2 = hex2dec(data(pos + 46 : pos + 46 + 3));
    env_data.ts = datetime('now', 'Format', 'yyyy-MM-dd HH:mm:ss');
end

function num = convertNumber(data, start, len)
    % Convert hexadecimal string to decimal number
    hex_str = data(start : start + len - 1);
    num = typecast(uint32(hex2dec(hex_str)), 'int32');
end

% Create a function to handle the scanning and decoding
function scanAndDecode(~, ~, s, macaddress, hObject)
    try
        % Retrieve stored data from the figure's appdata
        fig = ancestor(hObject, 'figure');
        storedData = guidata(fig);
        timeArray = storedData.timeArray;
        co2Array = storedData.co2Array;

        % Send the commands
        writeline(s, "AT+CENTRAL");
        write(s,13,"char");
        writeline(s, "AT+FINDSCANDATA="+macaddress+"=4");
        write(s,13,"char");

        % Pause for 4 seconds (assuming this is the time needed for scanning)
        pause(4);

        % Read the response
        response = '';
        while s.NumBytesAvailable > 0
            response = response + readline(s);
        end

        % Extract advertisement data from the last string
        lastLine = strsplit(response, newline);
        lastLine = lastLine{end};  % Get the last line
        advData = regexp(lastLine, '\[ADV\]:\s+(\w+)', 'tokens');

        % Display the advertisement data
        if ~isempty(advData)
            theData = adv_data_decode(advData{1}{1});
            disp(theData.co2); % Display CO2 data for example

            % Append new data points to arrays
            timeArray = [timeArray, datenum(theData.ts)]; % Convert datetime to serial date number
            co2Array = [co2Array, theData.co2];

            % Update stored data in the figure's appdata
            storedData.timeArray = timeArray;
            storedData.co2Array = co2Array;
            guidata(fig, storedData);

            % Update plot with new data points
            set(hObject, 'XData', timeArray, 'YData', co2Array);
            % Set x-axis to display time in the format of hours, minutes, and seconds
            datetick('x', 'HH:MM:SS');
            drawnow;
        else
            disp('No advertisement data found.');
        end

    catch e
        % Display any errors that occur
        disp("An error occurred: " + e.message);
    end
end

try
    % Create a serial port object
    s = serialport(portName, baudRate,"Timeout",2);
    configureTerminator(s, "LF");

    % Create a figure for plotting
    fig = figure;
    plotHandle = plot(NaN, NaN, 'o-');
    xlabel('Time');
    ylabel('CO2 Value');
    title('CO2 Value vs. Time');

    % Store data in the figure's appdata
    storedData.timeArray = [];
    storedData.co2Array = [];
    guidata(fig, storedData);

    % Create a timer object to run scanAndDecode every 10 seconds
    t = timer('ExecutionMode', 'fixedRate', 'Period', 10, ...
              'TimerFcn', {@scanAndDecode, s, macaddress, plotHandle});

    % Set the closerequestfcn callback to stop the timer and clear the serial port
    set(fig, 'closerequestfcn', {@stopScript, t, s});

    % Start the timer
    start(t);

catch e
    % Display any errors that occur
    disp("An error occurred: " + e.message);

    % Stop and delete the timer
    if exist('t', 'var') && isvalid(t)
        stop(t);
        delete(t);
    end

    % Close the serial port
    if exist('s', 'var') && isvalid(s)
        clear s;
    end
end

% Enable data cursors
dcm = datacursormode(gcf);
set(dcm, 'UpdateFcn', @customDataCursor);

% Custom data cursor function
function output_txt = customDataCursor(~, event_obj)
    % Get the data cursor position
    pos = get(event_obj, 'Position');

    % Convert the x-coordinate (time) to a formatted string
    timeString = datestr(pos(1), 'HH:MM:SS');

    % Create the output text to display
    output_txt = {['X: ', timeString], ['Y: ', num2str(pos(2))]}; % Customize as needed
end

function stopScript(~, ~, t, s)
    % Stop and delete the timer
    if exist('t', 'var') && isvalid(t)
        stop(t);
        delete(t);
    end

    % Close the serial port
    if exist('s', 'var') && isvalid(s)
        % Close the serial port
        delete(s);
    end

    % Close the figure
    delete(gcf);
end
Output
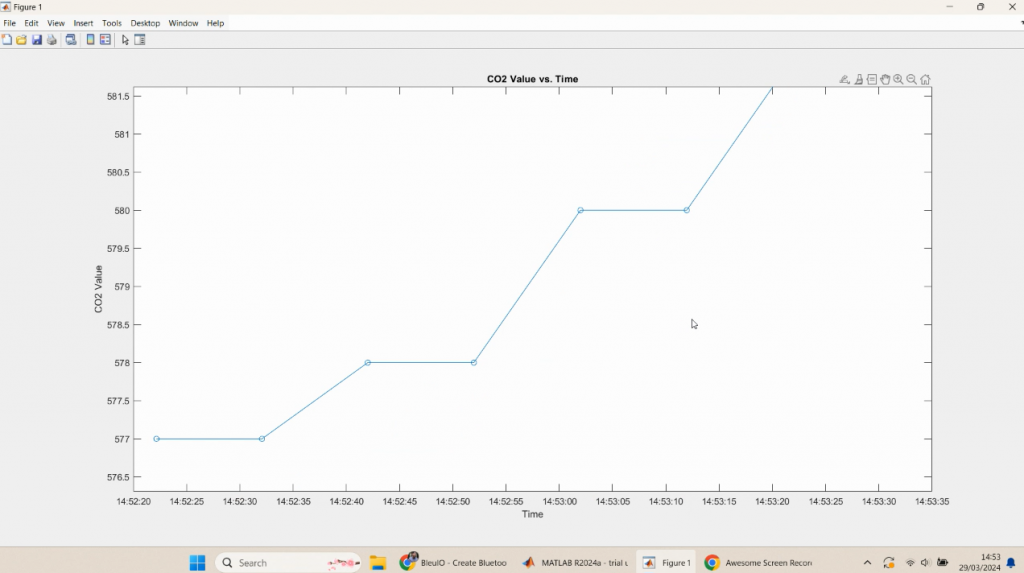
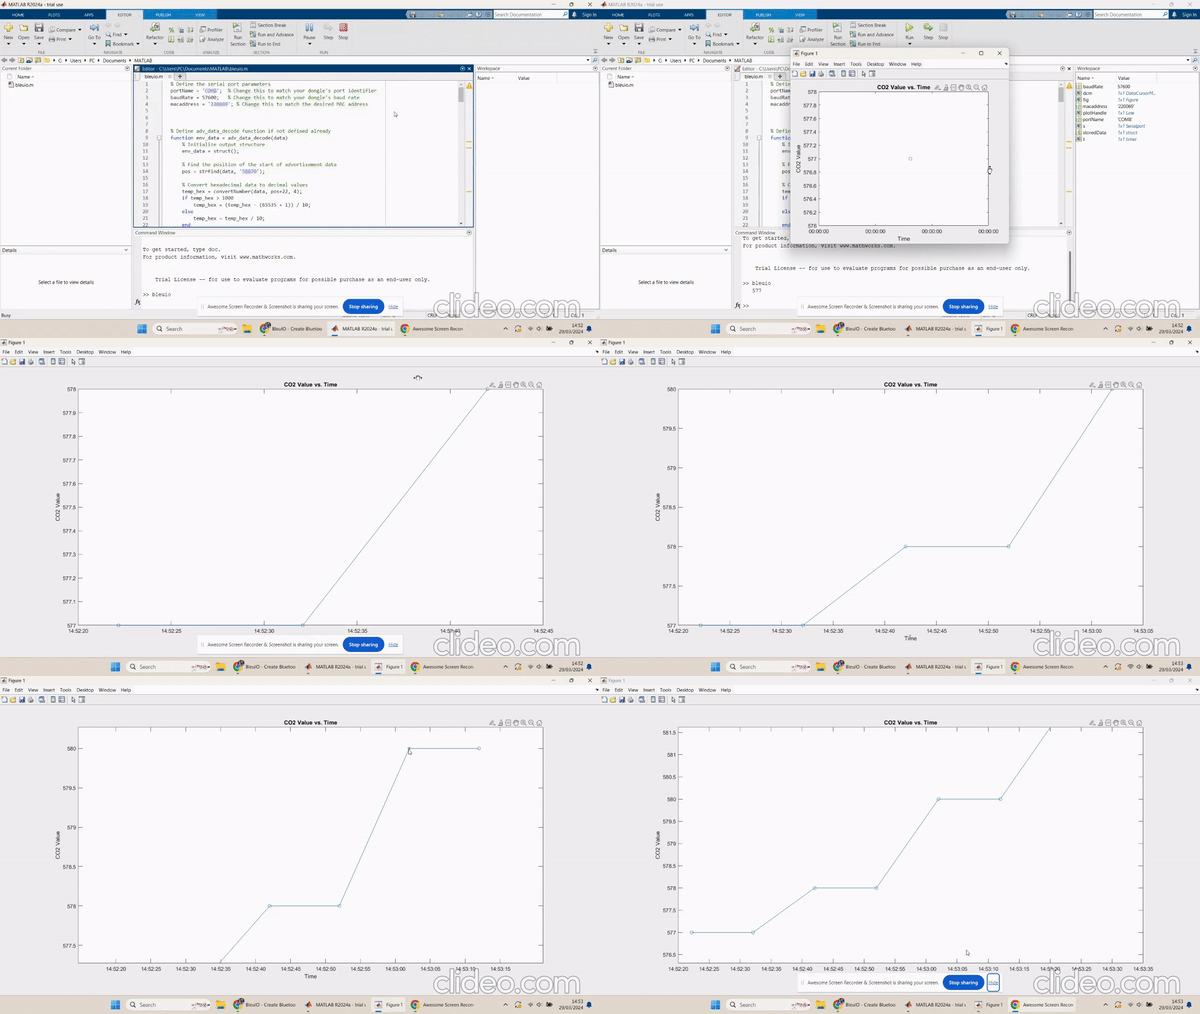
In this tutorial, we demonstrated how to read real-time air quality data from a BLE air quality monitoring device, such as HibouAir, using the BleuIO BLE USB dongle and MATLAB. By following the steps outlined in this tutorial, engineers, developers, and analysts can develop applications for monitoring air quality in various environments. This project has numerous potential applications, including indoor air quality monitoring in smart buildings, environmental monitoring in industrial settings, and health monitoring in healthcare facilities. By leveraging the power of BLE technology and MATLAB’s data analysis capabilities, users can gain valuable insights into air quality trends and make informed decisions to improve environmental conditions and human health.
